# Packages needed
{
  library("ggplot2") # plotting
  library("cowplot") # plotting
  library("RColorBrewer") # color palette
  library("sf") # spatial library
  library("spData") # river network
  library("maps") # borders of French departments
}Minimum distances from river network
spatial distance with R
dataviz
how-to
How to create a raster with distance values to the nearest river using a MULTILINESTRING sf object that corresponds to rivers.
# Import Seine river
data("seine")

# Import one department
# map("france", namesonly = TRUE, plot = FALSE) # get names of French departments
sm <- map("france", regions = "Seine-Maritime", fill = FALSE, col = "black",
          plot = FALSE)

# Convert to sf objects
sm_sf <- st_as_sf(sm)
seine_sf <- st_as_sf(seine)

# Crop seine to Seine-Maritime department
seine_int <- seine_sf %>%
  st_transform(crs = st_crs(sm_sf)) %>% # same CRS
  st_intersection(sm_sf) # crop
Warning: attribute variables are assumed to be spatially constant throughout
all geometries# Draw grid
sm_grid <- st_make_grid(sm_sf, cellsize = 0.05, what = "centers")
# Crop the grid to Seine-Maritime department
sm_grid_int <- st_intersection(sm_grid, sm_sf)
# Compute distance to Seine river
dist_seine <- st_distance(seine_int, sm_grid_int)
# Conversion to dataframe
dist_seine_df <- data.frame(dist_seine = as.vector(dist_seine)/1000,
st_coordinates(sm_grid_int))
# Plot
plot_grid(
ggplot(sm_sf) +
geom_sf(fill = "white") +
geom_sf(data = seine, color = "dodgerblue"),
ggplot(sm_sf) +
geom_sf(fill = "white") +
geom_sf(data = seine_int, color = "dodgerblue"),
ggplot(sm_grid_int) +
geom_sf(),
ggplot(dist_seine_df, aes(X, Y, fill = dist_seine)) +
geom_tile() +
geom_sf(data = sm_sf, inherit.aes = FALSE, fill = NA, size = 1) +
geom_sf(data = seine_int, inherit.aes = FALSE, color = "white") +
scale_fill_gradientn(colours = rev(brewer.pal(9, "Blues"))) +
labs(fill = "Distance to water (km)") +
theme_void() +
theme(legend.position = "bottom"),
nrow = 2, rel_widths = rep(1, 4), rel_heights = rep(1, 4), align = "vh")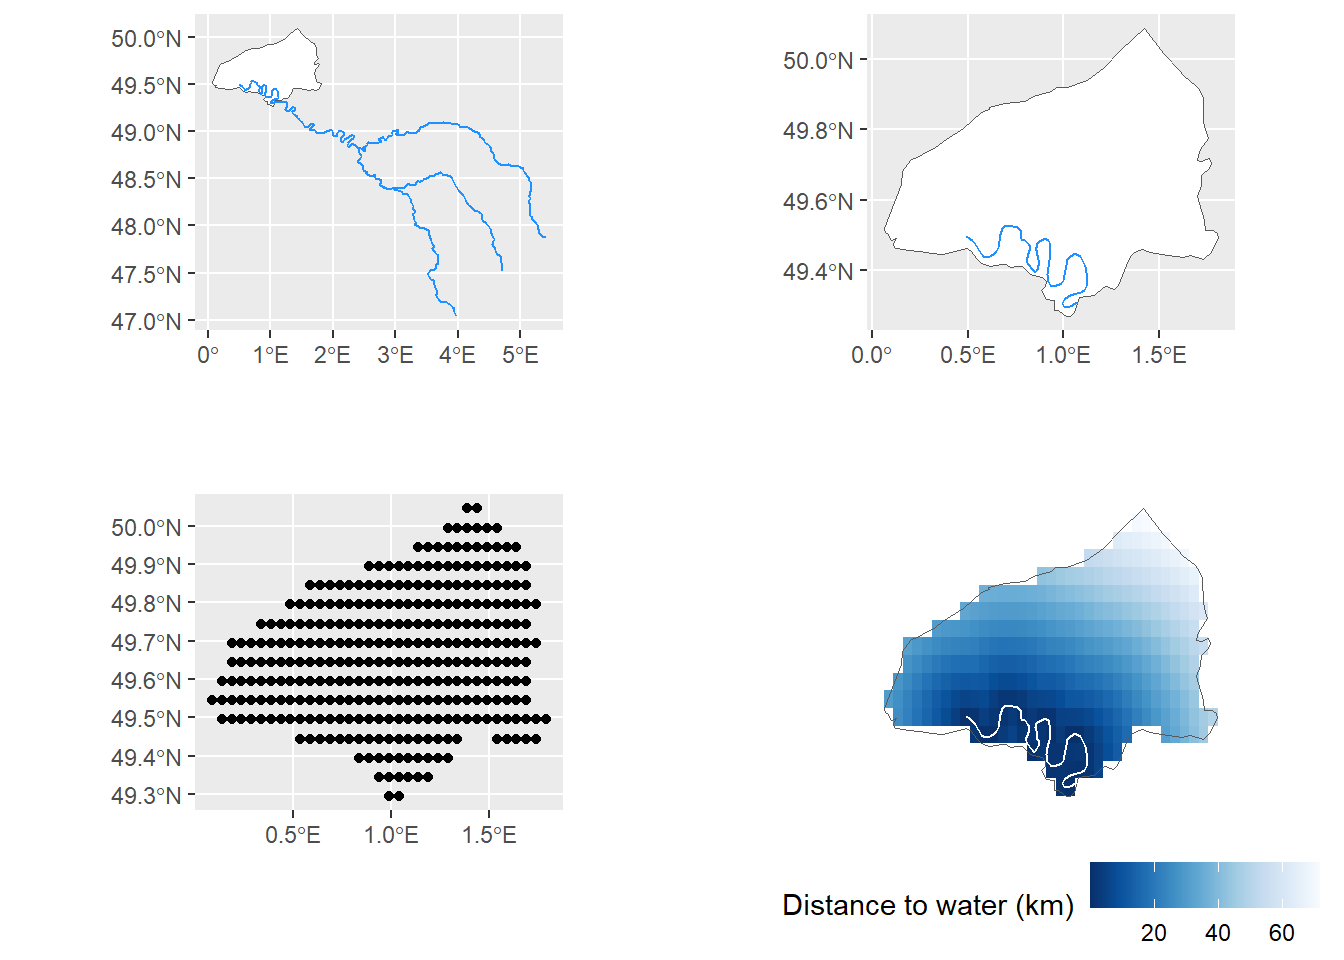
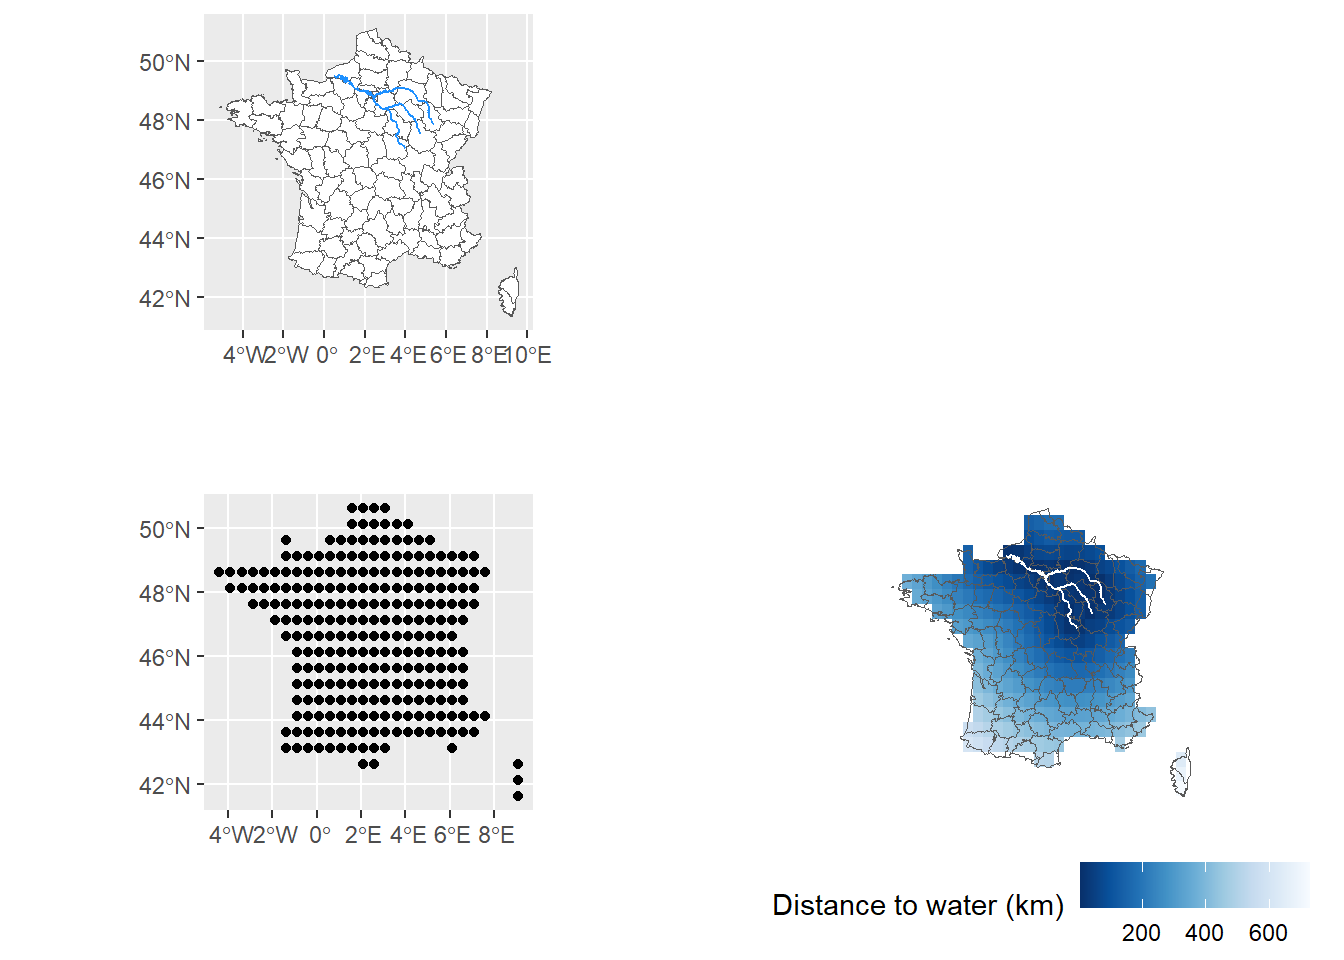
With a MULTILINESTRING object, a distance is computed between each raster cell of the grid and each segment. If interested into the closest distance, the minimum distance has to be extracted.
fr_departments <- map("france", fill = FALSE, col = "black", plot = FALSE)

fr_departments_sf <- st_as_sf(fr_departments)
seine_sf <- st_as_sf(seine)

sf_use_s2(FALSE)
Spherical geometry (s2) switched offseine_int <- seine_sf %>%
st_transform(crs = st_crs(fr_departments_sf)) %>% # same CRS
st_intersection(fr_departments_sf) # cropalthough coordinates are longitude/latitude, st_intersection assumes that they
are planarWarning: attribute variables are assumed to be spatially constant throughout
all geometriesfr_departments_grid <- st_make_grid(fr_departments_sf, cellsize = 0.5,
what = "centers")
# fr_departments_grid_int <- st_intersection(fr_departments_grid,
# fr_departments_sf)
# https://github.com/r-spatial/sf/issues/347
fr_departments_grid_int <- st_intersection(fr_departments_grid,
st_buffer(fr_departments_sf, 0))Warning in st_buffer.sfc(st_geometry(x), dist, nQuadSegs, endCapStyle =
endCapStyle, : st_buffer does not correctly buffer longitude/latitude datadist is assumed to be in decimal degrees (arc_degrees).although coordinates are longitude/latitude, st_intersection assumes that they
are planar# Compute distance to Seine river
dist_seine <- st_distance(seine_int, fr_departments_grid_int)
# Only minimum distance
dist_seine <- apply(dist_seine, 2, min)
# RDS object saved: cellsize = 0.1 for the grid
# dist_seine <- readRDS("D:/PIERRE_DENELLE/Stackoverflow/world_dist_rivers.rds")
dist_seine_df <- data.frame(dist_seine = as.vector(dist_seine)/1000,
st_coordinates(fr_departments_grid_int))
# Plot
plot_grid(
ggplot(fr_departments_sf) +
geom_sf(fill = "white") +
geom_sf(data = seine_int, color = "dodgerblue"),
NULL,
ggplot(fr_departments_grid_int) +
geom_sf(),
ggplot(dist_seine_df, aes(X, Y, fill = dist_seine)) +
geom_tile() +
geom_sf(data = fr_departments_sf, inherit.aes = FALSE, fill = NA, size = 1) +
geom_sf(data = seine_int, inherit.aes = FALSE, color = "white") +
scale_fill_gradientn(colours = rev(brewer.pal(9, "Blues"))) +
labs(fill = "Distance to water (km)") +
theme_void() +
theme(legend.position = "bottom"),
nrow = 2, rel_widths = rep(1, 4), rel_heights = rep(1, 4), align = "vh")